#Validate the model

mean_squared_error(y_true_tip, y_pred_tip)
#result
1.036019442011377


r2_score(y_true_tip, y_pred_tip)
#result
0.45661658635167657
Machine Learning
#import libraries

import sklearn
import numpy as np
import pandas as pd
import matplotlib.pyplot as plt
import seaborn as sns
sklearn.linear_model.LinearRegression:
- coef_
- intecept : Bias
- fit : training data
- predict
weights = [87, 81, 82, 92, 90, 61, 86, 66, 69, 69]
heights = [187, 174, 179, 192, 188, 160, 179, 168, 168, 174]
print(len(weights))
print(len(heights))
#dictionary format
body_df = pd.DataFrame({'height' : heights, 'weight' : weights})
body_df.head(3)

# result
height	weight
0	187	87
1	174	81
2	179	82
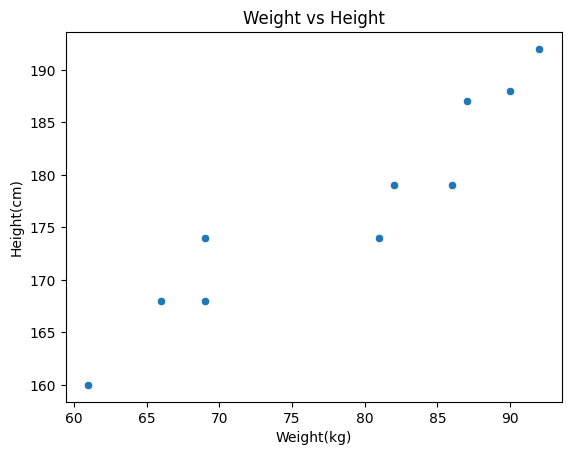
#Scatter plt
sns.scatterplot(data = body_df, x= 'weight', y='height')
plt.title('Weight vs Height')
plt.xlabel('Weight(kg)')
plt.ylabel('Height(cm)')

# Linear regression

from sklearn.linear_model import LinearRegression
model_lr = LinearRegression()
type(model_lr)
# DataFrame[] : Series format
# DataFrame[[]] : DataFrame

X = body_df[['weight']]
y = body_df[['height']]
X.head(3)

#result
weight
0	87
1	81
2	82
# Weight(w1)
print(model_lr.coef_[0][0])

# Bias
print(model_lr.intercept_[0])

#result
0.8625124535821027
109.36527488452137
w1 = model_lr.coef_[0][0]
w0 = model_lr.intercept_[0]
y(height) = x(weight) * 0.86 + 109.37
print('y = {}x + {}'.format(w1.round(2), w0.round(2)))

#result
y = 0.86x + 109.37
- Add predicted column
- calculate each error
- make it positive number by square
- Sum (MSE)
body_df['pred'] = body_df['weight'] * w1 + w0
body_df.head(3)

#result
height	weight	pred
0	187	87	184.403858
1	174	81	179.228784
2	179	82	180.091296
#error
body_df['error'] = body_df['height'] - body_df['pred']
body_df.head(3)

#result
height	weight	pred	error
0	187	87	184.403858	2.596142
1	174	81	179.228784	-5.228784
2	179	82	180.091296	-1.091296
body_df['error^2'] = body_df['error'] * body_df['error']
# MSE
body_df['error^2'].sum()/len(body_df)
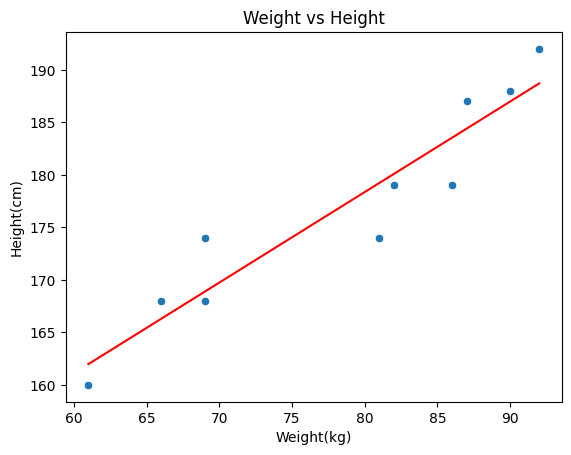
#Scatter plot with Linear regression

#Scatter plt
sns.scatterplot(data = body_df, x= 'weight', y='height')
sns.lineplot(data = body_df, x= 'weight', y='pred', c='red')
plt.title('Weight vs Height')
plt.xlabel('Weight(kg)')
plt.ylabel('Height(cm)')

Judge linear regression model
- predict : MSE (Mean square error)
- Rsquare value : 0 ~ 1
from sklearn.metrics import mean_squared_error
from sklearn.metrics import r2_score

# or

from sklearn.metrics import mean_squared_error, r2_score
# y True, Y pred

y_true = body_df['height']
y_pred = body_df['pred']
mean_squared_error(y_true, y_pred)

#result
10.152939045376309
#R2_scre
r2_score(y_true, y_pred)

#result
0.8899887415172141
#predict function

y_pred2 = model_lr.predict(body_df[['weight']])
y_pred2

#result
array([[184.40385835],
       [179.22878362],
       [180.09129608],
       [188.71642061],
       [186.99139571],
       [161.97853455],
       [183.54134589],
       [166.29109682],
       [168.87863418],
       [168.87863418]])
mean_squared_error(y_true, y_pred2)
#result
10.152939045376309
Tips data set
tips_df = sns.load_dataset('tips')
tips_df.head(3)

#result
total_bill	tip	sex	smoker	day	time	size
0	16.99	1.01	Female	No	Sun	Dinner	2
1	10.34	1.66	Male	No	Sun	Dinner	3
2	21.01	3.50	Male	No	Sun	Dinner	3
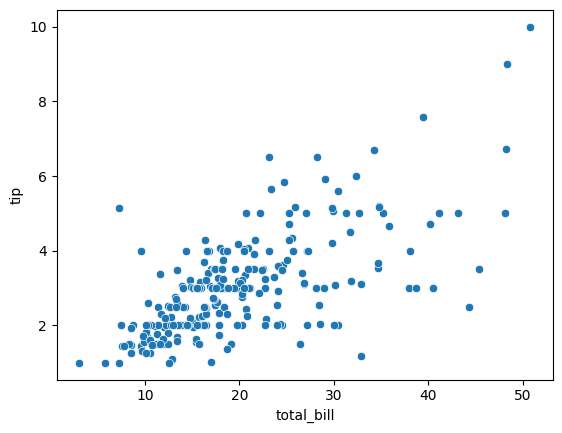
# X : total_bill
# y : tip

sns.scatterplot(data = tips_df, x=tips_df['total_bill'], y=tips_df['tip'])

model_lr2 = LinearRegression()
X = tips_df[['total_bill']]
y = tips_df[['tip']]

model_lr2.fit(X, y)
w2 = model_lr2.coef_[0][0]
w3 = model_lr2.intercept_[0]
print(w2)
print(w3)

#result
0.10502451738435337
0.9202696135546731
tips_df['pred'] = X * w2 + w3
tips_df.head(3)

#result
total_bill	tip	sex	smoker	day	time	size	pred
0	16.99	1.01	Female	No	Sun	Dinner	2	2.704636
1	10.34	1.66	Male	No	Sun	Dinner	3	2.006223
2	21.01	3.50	Male	No	Sun	Dinner	3	3.126835
print('y = {}x + {}'.format(w2.round(2), w3.round(2)))
#result
y = 0.11x + 0.92
#scatter plot with pred

sns.scatterplot(data = tips_df, x=tips_df['total_bill'], y=tips_df['tip'])
sns.lineplot(data = tips_df, x=tips_df['total_bill'], y=tips_df['pred'], c='Red')
plt.title('Total_bill vs Tip')
plt.xlabel('Tip')
plt.ylabel('Total_bill')
#Create predit line by method

y_true_tip = tips_df['tip']
y_pred_tip = model_lr2.predict(tips_df[['total_bill']])


y_pred_tip[:5]
#result
array([[2.70463616],
       [2.00622312],
       [3.12683472],
       [3.40725019],
       [3.5028225 ]])
'Study Note > Python' 카테고리의 다른 글
| Machine Learning [Regression] practice (1) | 2024.06.13 |
|---|---|
| pygwalker (0) | 2024.05.30 |
| Interactive Graphs with Altair (0) | 2024.05.30 |
| Multiple graphs (0) | 2024.05.30 |
| Dual-axis graph and Pyramid graph (0) | 2024.05.30 |


