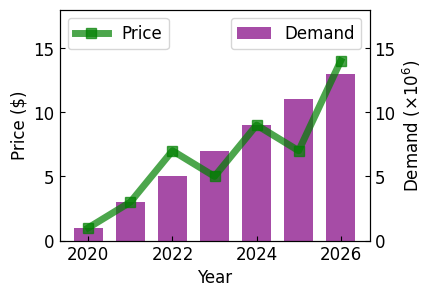
A dual-axis graph
A dual-axis graph is a type of graph that utilizes two separate y-axes to represent two different sets of data on the same plot. This allows for the comparison of two variables that may have different units or scales.
# 1. Setting the default style
plt.style.use('default')
plt.rcParams['figure.figsize'] = (4, 3)
plt.rcParams['font.size'] = 12

# 2. Preparing the data
x = np.arange(2020, 2027)
y1 = np.array([1, 3, 7, 5, 9, 7, 14])
y2 = np.array([1, 3, 5, 7, 9, 11, 13])

# 3. Drawing the graph
fig, ax1 = plt.subplots()

ax1.plot(x, y1, '-s', color='green', markersize=7, linewidth=5, alpha=0.7, label='Price')
ax1.set_ylim(0, 18)
ax1.set_xlabel('Year')
ax1.set_ylabel('Price ($)')
ax1.tick_params(axis='both', direction='in')

# Sharing x-axis (i.e., using dual-axis)
ax2 = ax1.twinx()
ax2.bar(x, y2, color='purple', label='Demand', alpha=0.7, width=0.7)
ax2.set_ylim(0, 18)
ax2.set_ylabel(r'Demand ($\times10^6$)')
ax2.tick_params(axis='y', direction='in')

# Label positioning
# Think of higher numbers showing labels on top more prominently.
# Compare with ax2.set_zorder(ax1.get_zorder() + 10)!
ax1.set_zorder(ax2.get_zorder() + 10)
ax1.patch.set_visible(False)

ax1.legend(loc='upper left')  # 범례 위치 설정
ax2.legend(loc='upper right')  # Legend positioning

plt.show()
Result

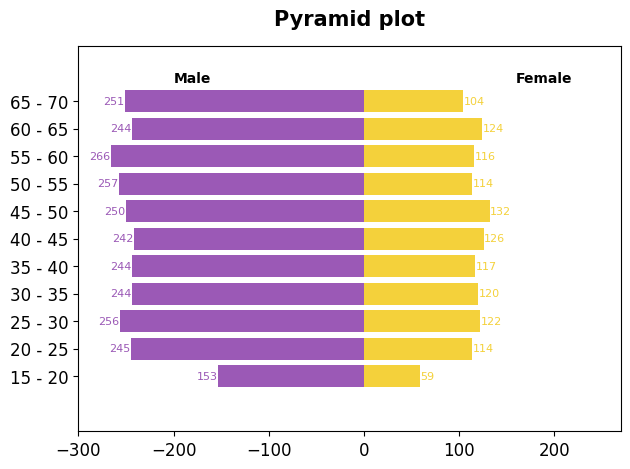
A pyramid graph
A pyramid graph, also known as a population pyramid, is a graphical representation of the age and gender distribution of a population. It typically consists of two vertical bar graphs, one representing males and the other representing females, with age groups arranged horizontally along the x-axis. The bars on each side of the pyramid represent the population size within each age group and gender category, allowing for easy comparison between genders and age groups.
# Function to plot a pyramid chart showing user counts by age group and gender
def plot_pyramid_chart(dataframe):
    # Age range settings
    bins = [10, 15, 20, 25, 30, 35, 40, 45, 50, 55, 60, 65, 70, 75, 80]
    bin_labels = [15, 20, 25, 30, 35, 40, 45, 50, 55, 60, 65, 70, 75, 80]

    # Dividing into absolute intervals using cut
    dataframe["bin"] = pd.cut(dataframe["Age"], bins=bins)

    # Mapping: 15 becomes "15-20"
    dataframe["age"] = dataframe["bin"].map(lambda x: str(x.left) + " - " + str(x.right))

    # Grouping by age and gender, counting user IDs
    grouped_data = dataframe.groupby(['age','Gender'])['Customer ID'].count().reset_index()
    pivot_table = pd.pivot_table(grouped_data, index='age', columns='Gender', values='Customer ID').reset_index()

    # Prepare data for plotting
    pivot_table["Female_Left"] = 0
    pivot_table["Female_Width"] = pivot_table["Female"]
    pivot_table["Male_Left"] = -pivot_table["Male"]
    pivot_table["Male_Width"] = pivot_table["Male"]

    mask = (pivot_table['Female'] > 0)
    pivot_table = pivot_table[mask].reset_index()

    # Plotting
    pyramid_plot = plt.figure(figsize=(7,5))

    plt.barh(y=pivot_table["age"], width=pivot_table["Female_Width"], color="#F4D13B", label="Female")
    plt.barh(y=pivot_table["age"], width=pivot_table["Male_Width"], left=pivot_table["Male_Left"],color="#9b59b6", label="Male")
    plt.xlim(-300,270)
    plt.ylim(-2,12)
    plt.text(-200, 10.7, "Male", fontsize=10, fontweight="bold")
    plt.text(160, 10.7, "Female", fontsize=10, fontweight="bold")

    for idx in range(len(pivot_table)):
        plt.text(x=pivot_table["Male_Left"][idx]-0.5, y=idx, s="{}".format(pivot_table["Male"][idx]),
                 ha="right", va="center",
                 fontsize=8, color="#9b59b6")
        plt.text(x=pivot_table["Female_Width"][idx]+0.5, y=idx, s="{}".format(pivot_table["Female"][idx]),
                 ha="left", va="center",
                 fontsize=8, color="#F4D13B")

    plt.title("Pyramid plot", loc="center", pad=15, fontsize=15, fontweight="bold")
    plt.legend(loc='upper right')  # Adding legend
    plt.show()

'Study Note > Python' 카테고리의 다른 글
| Interactive Graphs with Altair (0) | 2024.05.30 |
|---|---|
| Multiple graphs (0) | 2024.05.30 |
| Join, Merge, Concat, Append, and Pivot table (0) | 2024.05.23 |
| The difference between deep learning and machine learning (0) | 2024.05.21 |
| Seaborn plot (Scatter, Hist, and Box) (0) | 2024.05.16 |


