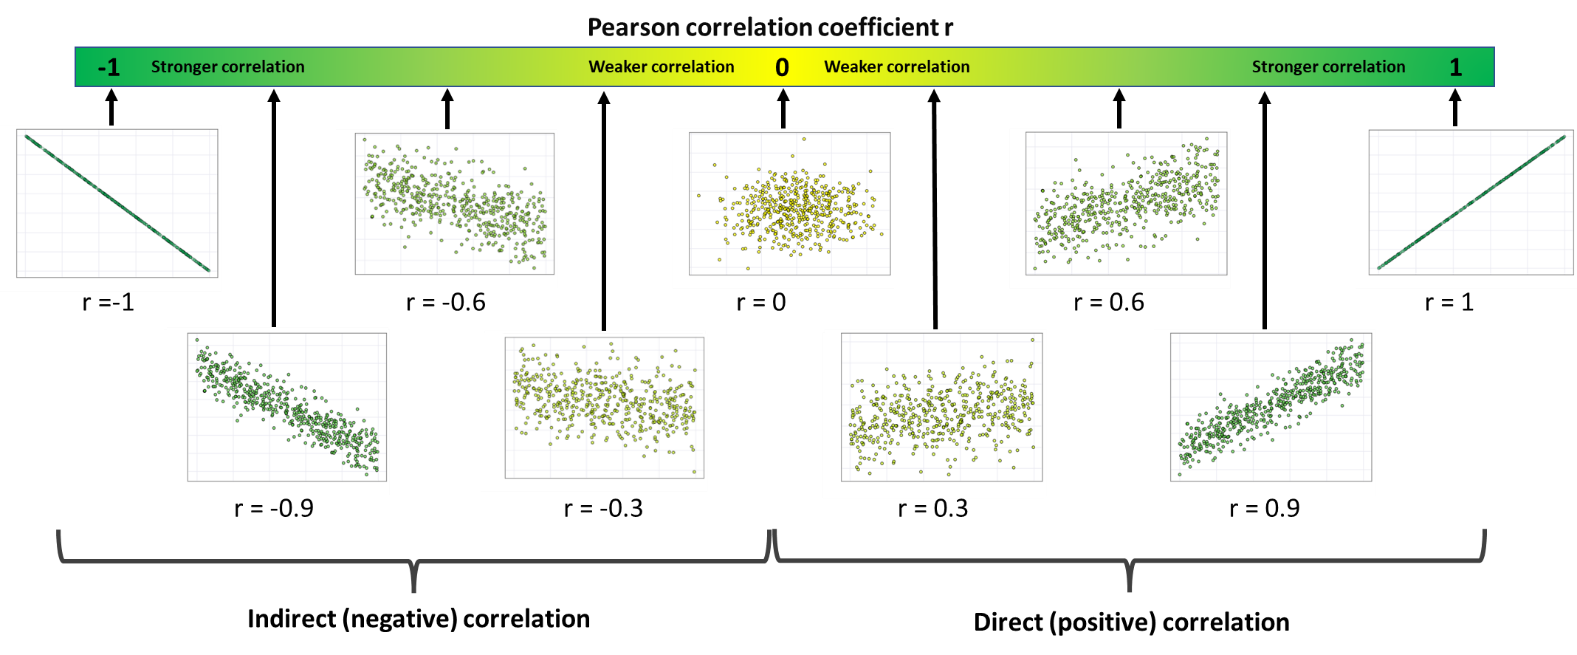
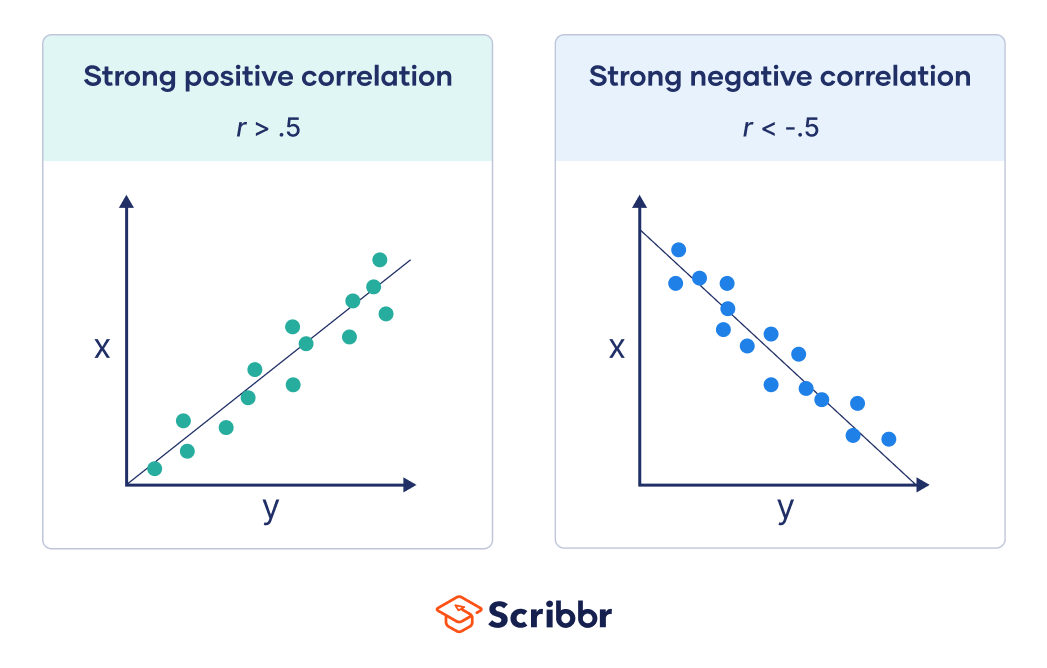
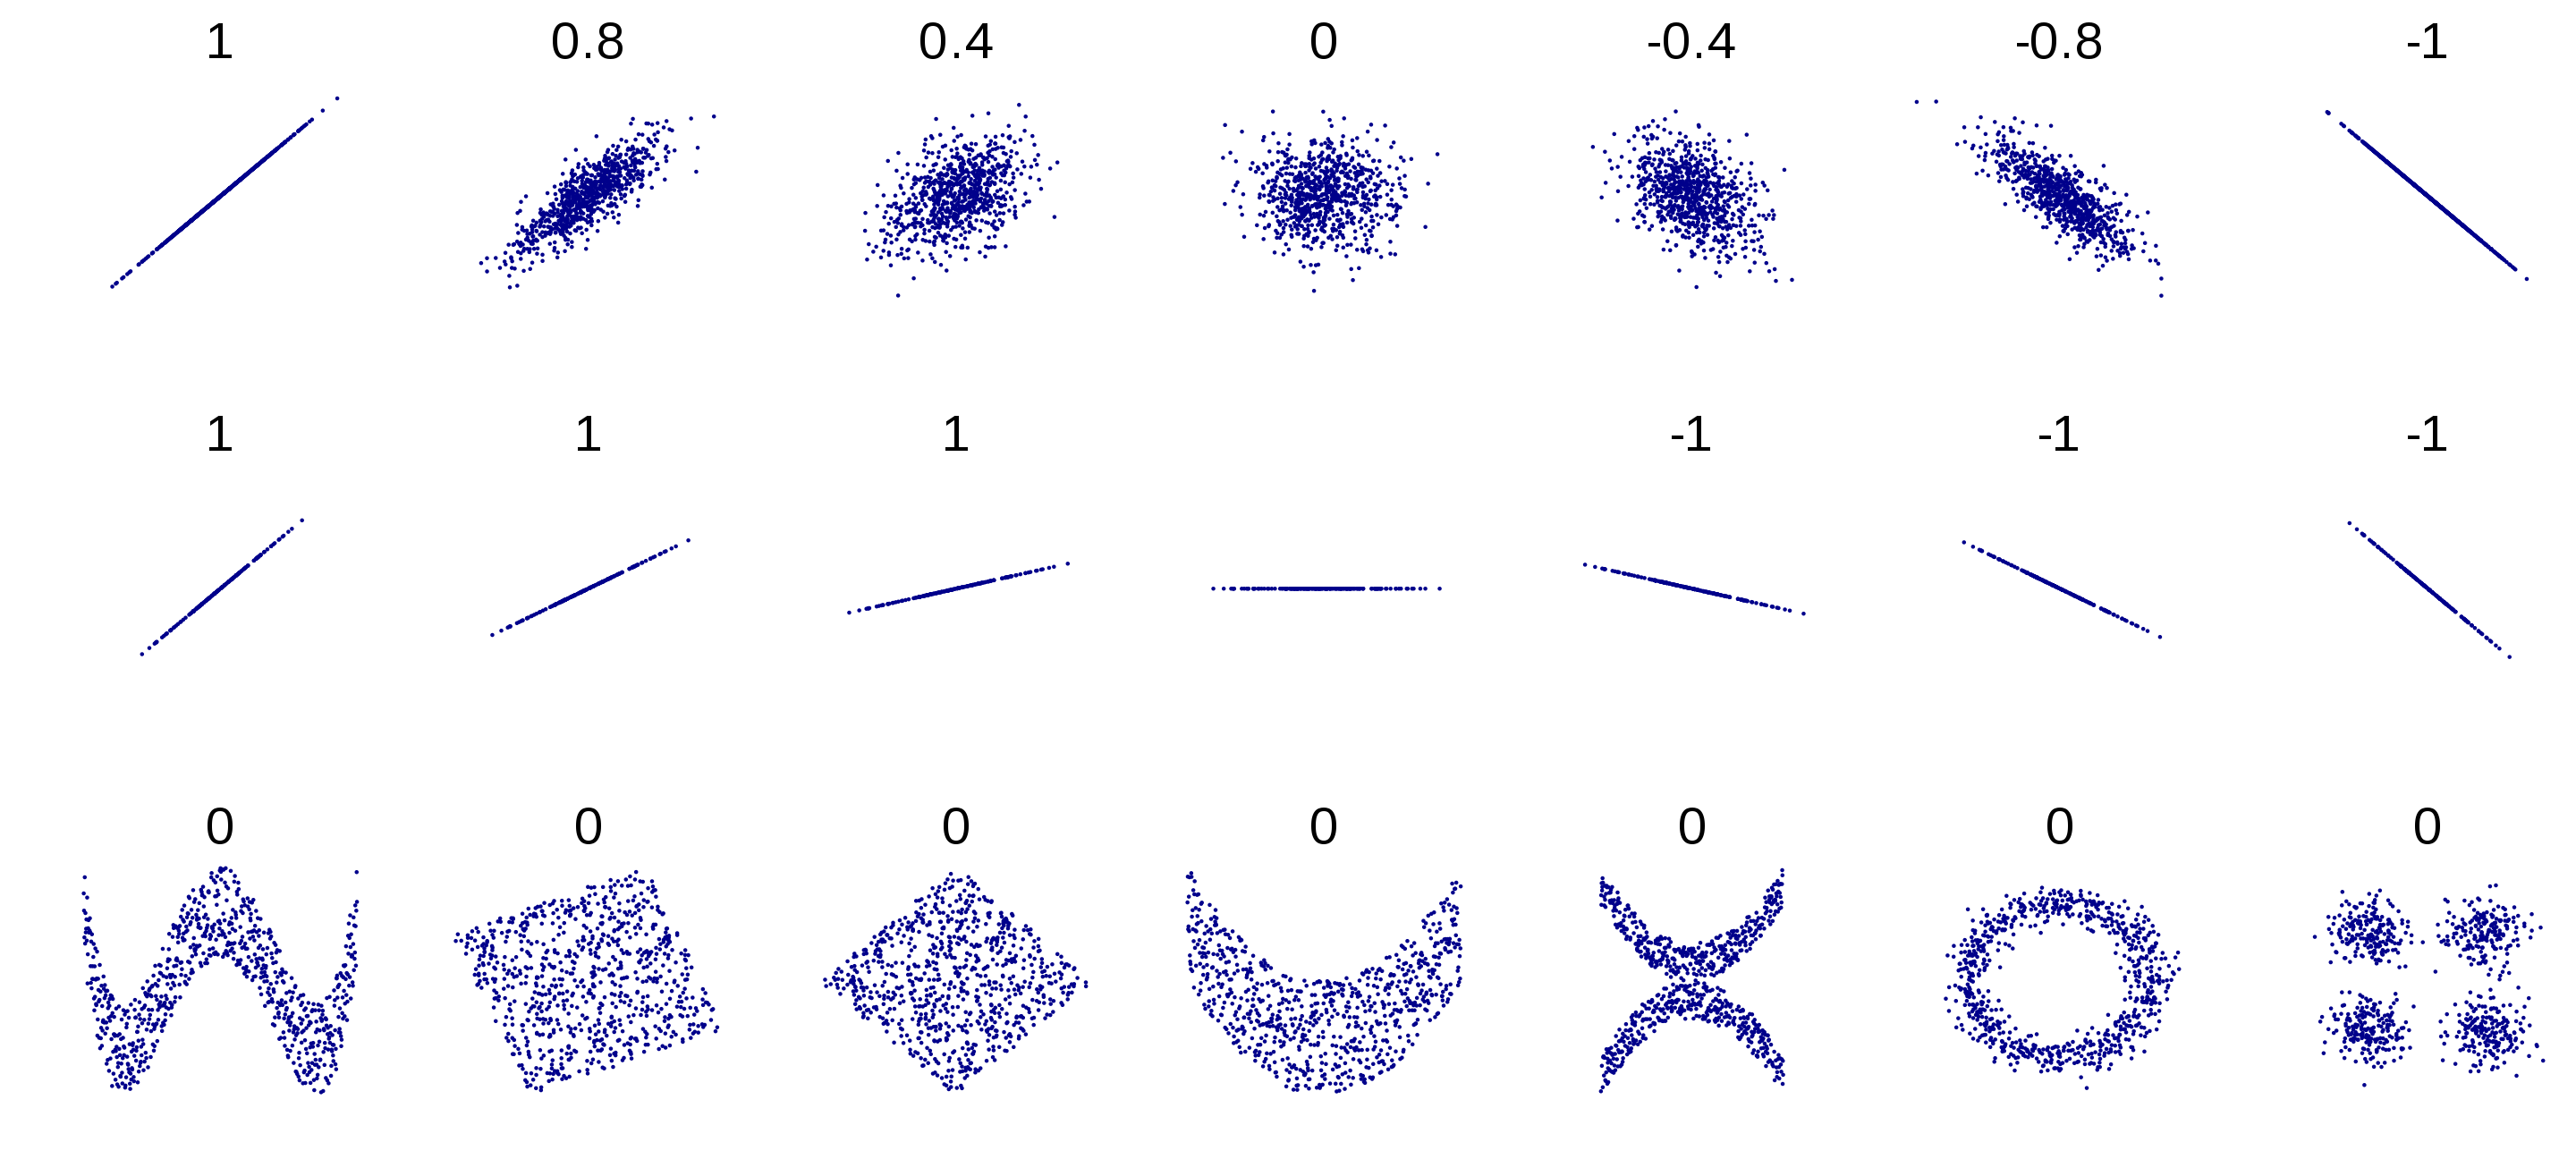
The Pearson correlation coefficient is a statistical method used to measure the linear relationship between two variables. It typically describes how two variables move together.
The Pearson correlation coefficient ranges from -1 to 1, and it is interpreted as follows:
- Close to 1: Indicates a strong positive linear relationship between the two variables. As one variable increases, the other variable tends to increase as well.
- Close to -1: Indicates a strong negative linear relationship between the two variables. As one variable increases, the other variable tends to decrease.
- Close to 0: Indicates little to no linear relationship between the two variables.
The Pearson correlation coefficient is calculated using the following formula:

Where 𝑟 represents the Pearson correlation coefficient, 𝑋𝑖 and 𝑌𝑖 are individual observation values of variables 𝑋 and 𝑌, and 𝑋ˉ and 𝑌ˉ are the means of variables 𝑋 and 𝑌, respectively.


https://www.questionpro.com/blog/pearson-correlation-coefficient/
Pearson Correlation Coefficient: Calculation + Examples
Learn about the Pearson correlation coefficient and know how to measure the relationship between two related variables using it. Calculation and examples.
www.questionpro.com
'Study Note > Data Analysis' 카테고리의 다른 글
| Chat with Your Data: Generative AI-Powered SQL Data Analysis (0) | 2025.06.20 |
|---|---|
| Exploratory Data Analysis (EDA) (0) | 2024.05.28 |
| Data preprocessing (0) | 2024.05.10 |
| What is Data Analyst? (0) | 2024.05.09 |
| Mece logic tree (0) | 2024.04.29 |


